This blog post will explain the external metric providers for Kubernetes, which allows us to autoscale our workloads.
Applications running inside a Kubernetes cluster might need to scale up or down. This scaling process is crucial for the performance and the responsivity of the application. Although we can use CPU and memory usage metrics to define our auto-scaling rules most of the time, it is not enough, and we may need to scale based on our application or business level metrics. Unfortunately, using custom and/or external metrics is not a built-in feature, and we need to add some extra tools for configuring it.
Since Kubernetes is highly extendable and configurable, many operators and options are available today, like custom metric autoscaling, OPA, and operators. By leveraging this, we can extend the Kubernetes API, add and/or remove new endpoints and route them to the custom services developed by third-party providers. For more details, you can check this link: https://kubernetes.io/docs/concepts/extend-kubernetes/operator/
Custom Metrics or External Metrics?
Even though they seem similar, custom and external metrics differ from each other. The custom metrics relate to in-cluster objects like pods, jobs etc., while the external metrics relate to external non-cluster objects like Cloud provider metrics (AWS Cloudwatch).
Since the default metrics scraped from Kubelet provide limited information about the resource metrics, we need some other tools. The major problem here is producing the metrics, exposing them and aggregating them in a central metric store.
Of course, there are various metric stores like APM Tools, Prometheus, InfluxDB, Telegraph, etc. Using Kubernetes Operators developed by the community, vendor or even by us, we can easily integrate metrics to the Kubernetes API.
So today, I’ll explain this architecture, how to configure external metrics and use them for autoscaling.
To make this integration, we have three main steps. Let’s look at them:
First step:
Configure the Kubernetes API aggregation layer, which allows Kubernetes to be extended by additional APIs.
Second step:
Deploy a monitoring solution for reading the metrics, like Prometheus.
Third step:
Deploy an adapter that enables the “external.metrics.k8s.io” endpoint. There are several adapters used for this purpose, like prometheus-adapter, KEDA and so on. In this blog post, we will use the KEDA to enable external metrics.
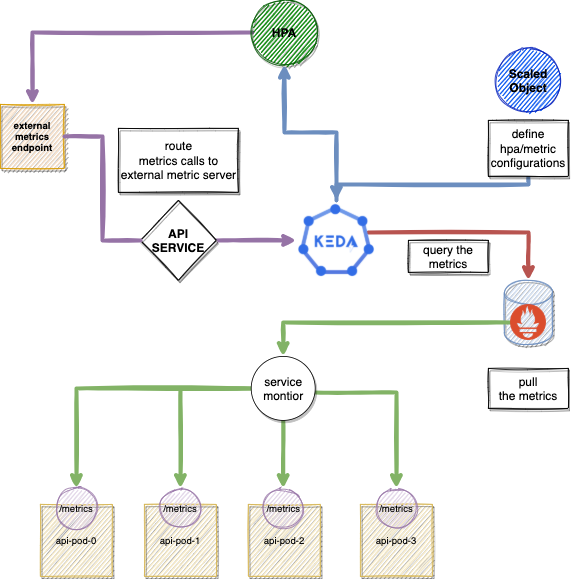
Below you can see the entire architecture that consists of three main components:
- API Service
- Prometheus
- KEDA
Now we can start deploying the solution:
Extending the Kubernetes API
We will start with the APIService objects on the Kubernetes side, which allow us to pass through the existing endpoints into another service.
APIService is an extension layer of Kubernetes api-server, and it allows us to proxy the request to extended api under a service object. Registering an api server is easy; we just need to create an APIService object and select the service name we want to route the requests. For more details, check this link.
As you can see below, when we create this APIService object, the API aggregation layer will proxy the request for the external metrics endpoint to the metric-adapter-service deployed by the adapter.
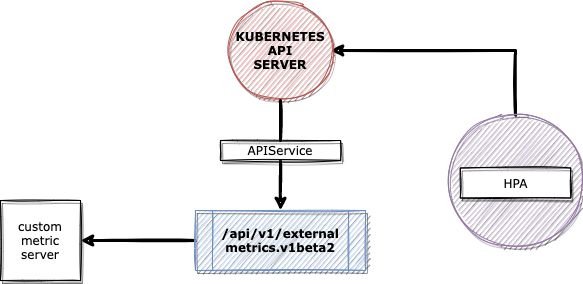
APIService objects route the external.metrics.k8s.io requests to another service deployed by the adapter.
By running “kubectl get apiservices | grep metrics” command, you can see which APIService definitions have been deployed in a Kubernetes cluster.
Metrics Integration with Prometheus
Prometheus is a widely used time-based metric database that we are going to use for our solution. To simplify the integration and configuration, we deployed the Prometheus with kube-prometheus-stack helm chart (You can check more details about installation from this link).
Kube-prometheus-stack is a very useful operator to manage Prometheus installation and configuration. It presents various CRD resources to manage the configuration of Prometheus, Grafana and Alertmanager.
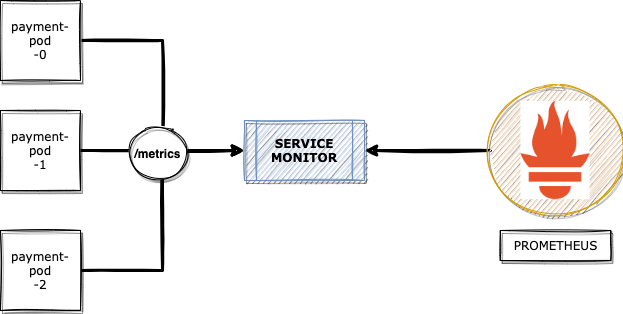
In order to read the metrics for your application, you have to define a ServiceMonitor: an object that tells Prometheus the service it needs to target.
Example ServiceMonitor definition:
This YAML definition contains the endpoint and ports, which present the metric values for us. Those address and port values are injected as targets into the Prometheus configuration.
Note: In the Prometheus context, we call the metric sources “exporters”. You can quickly develop your own exporters or integrate a third party. If you are interested in writing your own exporters, please check this link: https://prometheus.io/docs/instrumenting/writing_exporters/.
HPA and Metric Integration
So far, all looks good, but now we have to integrate those metrics with the metrics-server.
By default, the HPA reads the metrics from the metrics-server and scales the pods according to the metric threshold and current replicas.
If we want to add external or custom metrics, we have to feed them to HPA with two more additional endpoints:
- custom.metrics.k8s.io
- external.metrics.k8s.io
KEDA TIME!
Since we have already learned about the background of the metric integration with Prometheus and Kubernetes API, now we can proceed with the last part, the adapter.
KEDA is a useful and lightweight custom metric scaler tool that has a big and active community. You can also easily integrate KEDA with many different metric sources like your cloud provider, external addresses etc., with just a couple of simple configurations.
Let’s take a look at this diagram: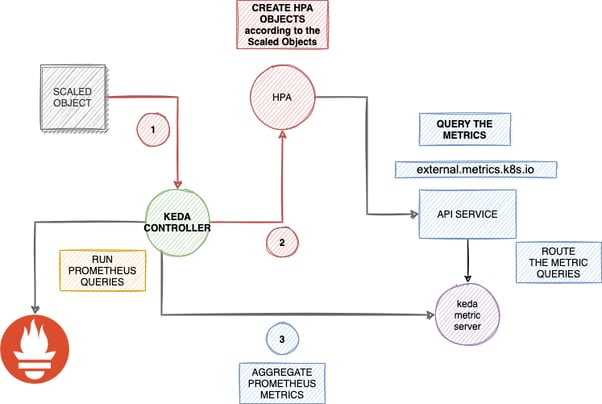
KEDA allows us to pull different kinds of metrics from many resources like SQS, REDIS etc. Therefore, you do not need to extract metrics from the external resources or your application metrics endpoints.
Installation
The KEDA project has a simple helm chart, and you can easily install it as below. Of course, it has different installation methods, and you can check more details about them on the Keda website https://keda.sh/docs/2.4/deploy/.
KEDA handles all the processes via Custom Resource definitions, configuring HPA and Prometheus queries via a single object. One important CRD is ScaledObject. ScaledObject is responsible for the HPA provisioning and triggering of the KEDA to run specified metric queries with related resources. We can easily define the max/min replica count values, threshold and address of the external metric place.
After we define these values, we can apply those resources. A couple of minutes later, HPA will be available.
Below are the key definitions of the ScaledObject for the Prometheus:
- serverAddress: Address of the Prometheus
- Query: Prometheus Query
- Threshold: Expected threshold values for the HPA
- metricName: Metric name to use
Those keys are just for the Prometheus stack. If you want to scale up with different scalers, you can check the https://keda.sh/ scalers chapter.
After deploying Keda and running the command below, we can see the exposed metrics like this;
Now we have exposed metrics via external.metric endpoints, and HPA is aware of the new metrics and ready to scale applications based on the threshold and replica count.
Conclusion:
With this blog post, we explained how to use KEDA to trigger HPA with Prometheus metrics.
Designing your application at scale requires careful planning. Before you jump into this process, you have to analyse and test your application behaviour. You can leverage KEDA’s capabilities and autoscale your applications based on your business logic and application perspective.
That’s all for now.
Do you use custom metrics?
Did you try any other metric adapters?
Let us know by commenting and if you liked this post, please don’t forget to share.