Kubernetes audit logs provide a chronological record of requests processed by the Kubernetes API server.
They help platform, security and operations teams answer questions such as:
- Who changed a Kubernetes resource?
- Which ServiceAccount accessed a Secret?
- Where did a failed API request originate?
- Who modified a RoleBinding or admission webhook?
- Was interactive access opened to a production Pod?
- Is Kubernetes API activity changing unexpectedly?
However, enabling audit logging does not automatically create useful visibility.
A production implementation must decide:
- Which Kubernetes API events should be recorded
- How much information each event should contain
- Where audit records should be stored
- Which events should become metrics or alerts
- How retention, access and ingestion costs should be controlled
This guide covers those decisions for both self-managed Kubernetes clusters and Amazon EKS.
Important update: Promtail reached end of life on 2 March 2026. New Loki-based implementations should use Grafana Alloy or another supported collector rather than building new Promtail pipelines.
What Kubernetes Audit Logs Actually Record
Every Kubernetes request passes through the kube-apiserver.
During this process, Kubernetes can generate an audit event containing information about the request, the requesting identity, the target resource and the result.
A typical audit event may include:
| Audit field | What it tells you |
|---|---|
| user.username | The user, ServiceAccount or component that made the request |
| user.groups | The groups associated with the requesting identity |
| verb | The Kubernetes operation, such as get, create, patch or delete |
| objectRef.resource | The type of resource being accessed |
| objectRef.namespace | The namespace containing the resource |
| objectRef.name | The name of the target resource |
| sourceIPs | The source addresses associated with the request |
| userAgent | The client or Kubernetes component making the request |
| responseStatus.code | The resulting HTTP response code |
| annotations | Additional context, including the authorisation decision |
| requestReceivedTimestamp | When the API server received the request |
| stageTimestamp | When the recorded audit stage was reached |
Kubernetes audit events can be recorded at different stages of the request lifecycle:
- RequestReceived
- ResponseStarted
- ResponseComplete
- Panic
The Kubernetes audit policy determines which requests and stages are retained.
Audit Logs Are Not a Complete Kubernetes Observability Strategy
Audit logs focus on Kubernetes API activity. They do not provide complete visibility into every action inside a cluster.
| Signal | Main question answered |
|---|---|
| Audit logs | Who requested or changed something through the Kubernetes API? |
| API server metrics | Is the control plane healthy and performing normally? |
| Distributed traces | Where did a slow request spend its time? |
| Application logs | What happened inside the application? |
| Runtime security events | What happened inside a running container or on a node? |
| Cloud audit logs | Which cloud provider APIs were called, and by which identity? |
For example, Kubernetes audit logs can show that a user requested pods/exec. They will not provide a complete record of every command subsequently executed inside the container.
Audit logging should therefore be part of a wider Kubernetes security and observability architecture rather than treated as a standalone security control.
Design the Audit Policy Before Building the Pipeline
A common mistake is to collect as much information as possible and decide how to use it later.
This can create:
- Large volumes of low-value audit events
- Higher ingestion and storage costs
- Additional API server memory usage
- Slower investigations
- Sensitive request or response bodies being stored unnecessarily
- Alerts that are too noisy to act on
Kubernetes supports four audit levels.
| Level | Recorded information | Typical use |
|---|---|---|
| None | Nothing | Health checks and known low-value traffic |
| Metadata | Identity, time, resource, verb and result | General activity monitoring |
| Request | Metadata and request body | Selected configuration changes |
| RequestResponse | Metadata, request body and response body | Narrow investigations requiring full context |
The rules in an audit policy are processed in order. The first matching rule wins.
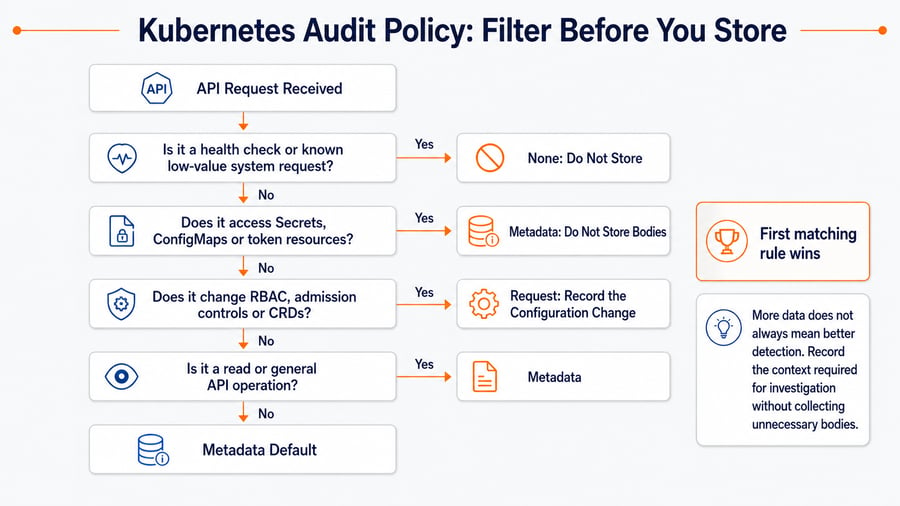
This means specific exclusions and sensitive-resource rules must appear before broad default rules.
A Production-Aware Audit Policy Example
The following example is deliberately conservative.
It removes common low-value requests, avoids capturing Secret and ConfigMap bodies, records selected security-related configuration changes and uses Metadata as the final default.
apiVersion: audit.k8s.io/v1
kind: Policy

omitStages:
  - RequestReceived

rules:
  # Exclude common health and readiness checks.
  - level: None
    nonResourceURLs:
      - "/healthz*"
      - "/livez*"
      - "/readyz*"
      - "/version"

  # Exclude known high-volume kube-proxy watch operations.
  - level: None
    users:
      - "system:kube-proxy"
    verbs:
      - "watch"
    resources:
      - group: ""
        resources:
          - "endpoints"
          - "services"
          - "services/status"

  # Record access to sensitive resources without storing their bodies.
  - level: Metadata
    resources:
      - group: ""
        resources:
          - "secrets"
          - "configmaps"
          - "serviceaccounts/token"

  # Capture request bodies for selected security-related changes.
  - level: Request
    verbs:
      - "create"
      - "update"
      - "patch"
      - "delete"
      - "deletecollection"
    resources:
      - group: "rbac.authorization.k8s.io"
        resources:
          - "roles"
          - "rolebindings"
          - "clusterroles"
          - "clusterrolebindings"

      - group: "admissionregistration.k8s.io"
        resources:
          - "mutatingwebhookconfigurations"
          - "validatingwebhookconfigurations"

      - group: "apiextensions.k8s.io"
        resources:
          - "customresourcedefinitions"

  # Track interactive access to containers without capturing full bodies.
  - level: Metadata
    resources:
      - group: ""
        resources:
          - "pods/exec"
          - "pods/attach"
          - "pods/portforward"

  # Record read activity at Metadata level.
  - level: Metadata
    verbs:
      - "get"
      - "list"
      - "watch"

  # Metadata is the default for everything not matched above.
  - level: Metadata
This example should be treated as a starting point, not a universal policy.
A production policy should be adjusted according to:
- Cluster size and API request volume
- Regulatory and audit requirements
- Workload sensitivity
- Incident investigation requirements
- Existing SIEM or observability tooling
- Acceptable storage and ingestion costs
- The identities and controllers operating in the cluster
RequestResponse should only be enabled for narrowly defined resources and operations. Using it broadly can capture sensitive data and significantly increase log volume.
Scope note: This custom audit policy example applies to self-managed Kubernetes. On Amazon EKS, AWS manages the control plane audit policy. Customers configure whether audit records are delivered to CloudWatch Logs and how those records are retained, queried and monitored.
Configuring Audit Logging in a Self-Managed Kubernetes Cluster
For self-managed Kubernetes, audit logging is configured through the API server.
For the file-based audit log backend, the API server needs:
--audit-policy-file="/etc/kubernetes/audit-policy.yaml"
--audit-log-path="/var/log/kubernetes/audit/audit.log"
File rotation should also be configured.
--audit-log-maxage=7
--audit-log-maxbackup=10
--audit-log-maxsize=100
These values are examples. Retention and rotation must be sized for the cluster’s request volume and the external log shipping interval.
When the API server runs as a static Pod, as it commonly does in kubeadm-based clusters, both the policy file and audit log directory must be mounted into the API server container.
The log directory also needs to remain available on the control plane host so that audit records can be collected and persisted outside the node.
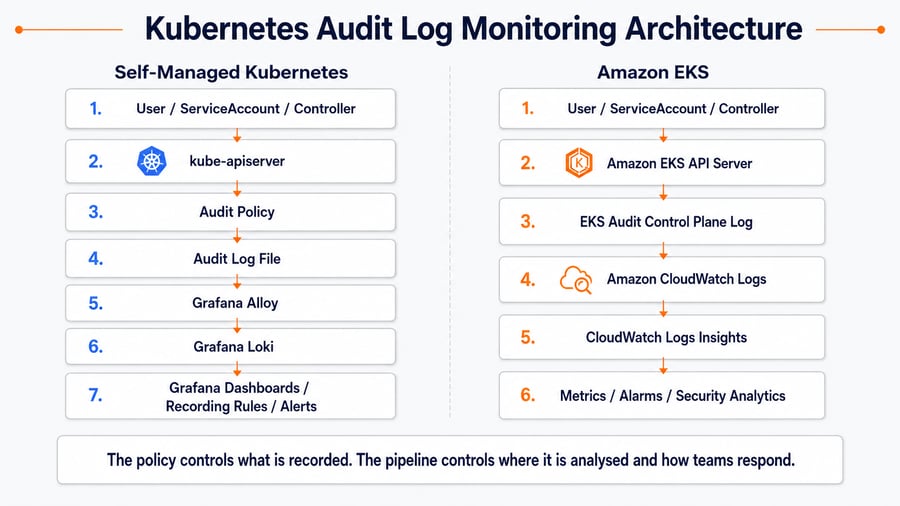
A typical architecture is:
kube-apiserver
    ↓
Local audit file
    ↓
Grafana Alloy on each control plane node
    ↓
Grafana Loki
    ↓
Grafana dashboards and alerts
Shipping Kubernetes Audit Logs with Grafana Alloy
Grafana Alloy can read audit files from the control plane host and send them to Loki.
A minimal Alloy configuration looks like this:
local.file_match "kubernetes_audit" {
  path_targets = [
    {
      __path__    = "/var/log/kubernetes/audit/*.log",
      job         = "kubernetes-audit",
      cluster     = "production-eu-west-2",
      environment = "production",
    },
  ]
}

loki.source.file "kubernetes_audit" {
  targets    = local.file_match.kubernetes_audit.targets
  forward_to = [loki.write.audit.receiver]
}

loki.write "audit" {
  endpoint {
    url = "https://<loki-endpoint>/loki/api/v1/push"
  }
}
Authentication, TLS configuration and secret handling have been omitted from the example and must be added for the target environment.
The example does not set tail_from_end = true. When that option is enabled and no saved file position exists, Alloy begins reading at the end of the file and does not ingest older entries already present in it.
Where Alloy Should Run
The collector must have access to the host path where the API server writes audit records.
Possible deployment models include:
- Alloy installed as a system service on each control plane node
- Alloy deployed as a DaemonSet with control plane tolerations
- A dedicated collector process managed through the host operating system
- A webhook-based architecture that sends audit events to a remote backend
When using a DaemonSet, check:
- Control plane taints and tolerations
- Node selectors
- Read-only host path mounts
- File ownership and permissions
- Collector resource limits
- Buffering and retry behaviour
- What happens when Loki is temporarily unavailable
Audit log collection should not introduce a new failure path for the Kubernetes API server.
Be Careful with Loki Labels
Audit records contain many fields that appear useful as labels but have very high cardinality.
Avoid turning values such as these into Loki index labels:
- auditID
- Username
- Source IP
- Resource name
- Pod name
- Request URI
- ServiceAccount name
- Trace or request identifiers
High-cardinality labels create many short-lived Loki streams and can significantly affect index size, query performance and storage behaviour.
Prefer a small set of stable labels:
- Cluster
- Environment
- Region
- Log type
- Platform
- Tenant, when applicable
Fields such as usernames, resource names and source IPs should remain inside the structured JSON record and be parsed when queried.
Monitor the Audit Pipeline Itself
Collecting audit events is not sufficient. Teams also need to know when the audit pipeline stops working.
For self-managed API servers, monitor:
rate(apiserver_audit_event_total[5m])This indicates the rate of audit events generated and sent to the configured backend.
Audit errors should remain at zero:
sum(rate(apiserver_audit_error_total[5m])) > 0Metric stability: Kubernetes currently classifies apiserver_audit_event_total and apiserver_audit_error_total as Alpha metrics. Confirm their availability against the Kubernetes version used by your cluster before depending on them in production alerts.
An alert should also detect:
- Audit log files that are no longer receiving events
- Alloy collection failures
- Events rejected by Loki
- Unexpected ingestion-volume drops
- Audit storage approaching capacity
- Recording or alerting rule evaluation failures
A security control that can fail silently is not a reliable security control.
Monitoring Kubernetes Audit Logs on Amazon EKS
Amazon EKS manages the Kubernetes control plane, so customers do not have direct access to its audit files or control the underlying audit policy.
EKS can deliver control plane audit logs to Amazon CloudWatch Logs when the audit log type is enabled for the cluster.
The required control plane log types must be selected on a per-cluster basis. When enabled, EKS sends the selected logs to CloudWatch Logs in the same AWS account.
The following AWS CLI command enables the audit log type:
aws eks update-cluster-config \
  --region eu-west-2 \
  --name production-cluster \
  --logging '{
    "clusterLogging": [
      {
        "types": ["audit"],
        "enabled": true
      }
    ]
  }'
When enabled, the logs are stored in a CloudWatch log group using the following pattern:
/aws/eks/<cluster-name>/clusterEKS supports several control plane log types:
- api
- audit
- authenticator
- controllerManager
- scheduler
The audit log provides Kubernetes API activity. The other control plane logs answer different operational questions and may also be needed when investigating control plane performance or authentication behaviour.
Enabling these logs creates CloudWatch ingestion, storage and query costs. Retention should therefore be explicitly configured rather than leaving log groups without a defined lifecycle.
For broader AWS and EKS security controls, audit logging should be designed alongside IAM, Kubernetes RBAC, network security and AWS cloud security requirements.
Querying EKS Audit Logs with CloudWatch Logs Insights
Once audit logging is enabled, CloudWatch Logs Insights can be used to investigate activity and build detection logic.
1. Find Failed Anonymous Requests
fields @timestamp,
       user.username,
       sourceIPs.0,
       verb,
       objectRef.resource,
       responseStatus.code

| filter @logStream like /kube-apiserver-audit/
| filter user.username = "system:anonymous"
| filter responseStatus.code in [401, 403]
| sort @timestamp desc
| limit 100
A sudden increase may indicate:
- Incorrectly configured applications
- External scanning
- Expired or missing credentials
- A service communicating with the wrong API endpoint
- An attempted unauthorised access path
2. Find Changes to RBAC Resources
fields @timestamp,
       user.username,
       verb,
       objectRef.resource,
       objectRef.namespace,
       objectRef.name,
       responseStatus.code

| filter @logStream like /kube-apiserver-audit/
| filter objectRef.resource in [
    "roles",
    "rolebindings",
    "clusterroles",
    "clusterrolebindings"
  ]
| filter verb in ["create", "update", "patch", "delete"]
| sort @timestamp desc
| limit 100
RBAC changes should be correlated with:
- Deployment pipelines
- Approved change windows
- The identity performing the change
- Ticket or change records
- The privileges granted by the resulting configuration
3. Find Interactive Pod Access
fields @timestamp,
       user.username,
       sourceIPs.0,
       objectRef.namespace,
       objectRef.name,
       objectRef.subresource,
       responseStatus.code

| filter @logStream like /kube-apiserver-audit/
| filter objectRef.resource = "pods"
| filter objectRef.subresource in ["exec", "attach", "portforward"]
| sort @timestamp desc
| limit 100
Interactive access may be legitimate during incident response, but it should be rare and attributable in production environments.
4. Track Denied API Requests Over Time
fields @timestamp
| filter @logStream like /kube-apiserver-audit/
| filter responseStatus.code in [401, 403]
| stats count(*) as denied_requests by bin(5m)
This query converts individual audit events into a time-series signal that can be reviewed against a normal cluster baseline.
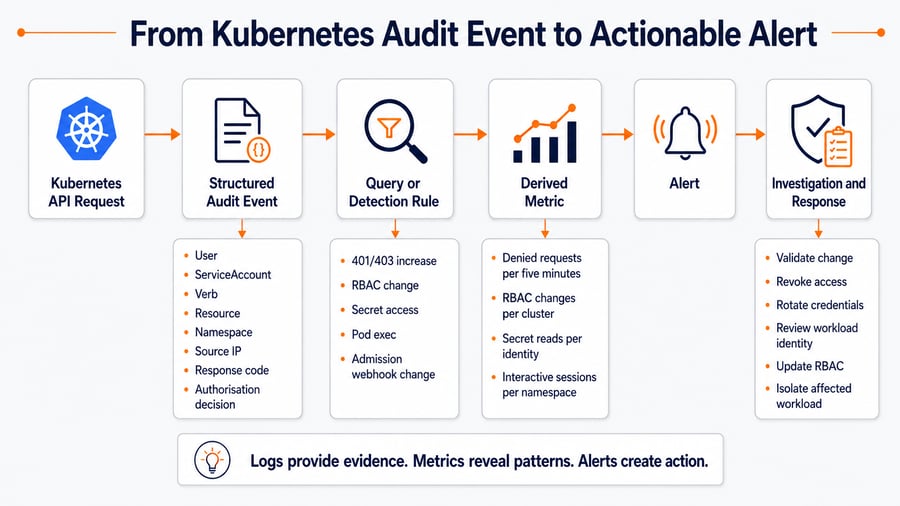
Turning Audit Events into Metrics and Alerts
Audit logs are events.
Metrics are aggregated time-series signals derived from those events.
A single 403 response may not be important. Fifty denied requests from the same identity or source within five minutes may require investigation.
Useful audit-derived signals include:
| Signal | Example detection logic | Potential action |
|---|---|---|
| Failed authentication rate | Count 401 responses over five minutes | Investigate identity or credential failures |
| Authorisation denial rate | Count 403 responses by user and source | Check RBAC or attempted access |
| RBAC mutations | Create, patch or delete against RBAC resources | Validate against an approved change |
| Secret access | Reads by unusual users or ServiceAccounts | Review workload identity and scope |
| Interactive Pod access | Exec, attach or port-forward activity in production | Confirm operational approval |
| Admission control changes | Changes to validating or mutating webhooks | Review cluster-wide security impact |
| CRD changes | Create, update or delete of CRDs | Check platform and operator changes |
| Anonymous activity | Requests from system:anonymous | Validate API exposure and clients |
| Impersonation use | Requests containing impersonated identities | Confirm approved administrative use |
| Event-volume change | Sudden increase or decrease in audit events | Check cluster activity or pipeline health |
Thresholds should not be copied between environments without validation.
Development, CI and production clusters will have different request patterns. Baselines should account for:
- Deployment frequency
- Controller activity
- Autoscaling
- GitOps reconciliation
- Scheduled jobs
- Cluster upgrades
- Backup operations
- Security scanning
For Loki environments, LogQL metric queries can aggregate matching audit records. Frequently used queries can be evaluated continuously through Loki recording rules. When remote write is configured, the resulting samples can be sent to a Prometheus-compatible metrics backend.
For CloudWatch, teams can use:
- CloudWatch Logs Insights queries
- Metric filters
- CloudWatch alarms
- Subscription filters
- Lambda-based processing
- Amazon Security Lake or a central security analytics platform
The target architecture should match the expected event volume and investigation workflow rather than introducing another disconnected dashboard.
Cost, Retention and Security Considerations
1. Audit Logging Has a Control Plane Cost
The API server must retain audit context while requests are processed.
Broad Request or RequestResponse rules can increase memory usage, processing requirements and event volume. Monitor audit volume before and after policy changes rather than assuming the new policy has no platform impact.
2. CloudWatch Entries Can Be Truncated
Amazon CloudWatch Logs has a maximum log entry size that is smaller than the maximum Kubernetes API request size.
Large EKS audit entries may therefore be truncated or contain only request metadata. Detection logic should not assume every record contains a complete request or response body.
3. Retention Must Be Configured Explicitly
Retention should reflect:
- Investigation requirements
- Compliance requirements
- Expected incident detection time
- Storage cost
- Legal or contractual obligations
- Archive requirements
A practical design may use:
- Shorter retention in the actively queried platform
- Longer-term archive in lower-cost object storage
- Restricted access to archived audit records
- Documented deletion and legal-hold procedures
In Loki, retention must be deliberately configured through the Compactor and storage lifecycle settings.
In CloudWatch, define a retention period for each EKS control plane log group.
4. Protect Audit Logs from Modification
Audit records can contain sensitive security information.
Controls should include:
- Encryption in transit and at rest
- Restricted read access
- Separate administrative permissions
- Protected storage
- Controlled retention changes
- Monitoring for log deletion or export changes
- An audit trail for access to the audit data itself
The people operating workloads should not automatically have permission to delete the records used to investigate their activity.
5. Avoid Alerting Without Ownership
Every production alert needs:
- A clear owner
- A defined severity
- Investigation steps
- Required context
- An escalation path
- A response expectation
- A test process
An alert that nobody owns will eventually be ignored.
Common Kubernetes Audit Logging Mistakes
Logging Everything at RequestResponse
This generates large volumes of data and may store sensitive content without improving detection.
Treating Audit Logs as Runtime Security
Audit logs record API activity. They do not replace container runtime, node, network or application-level security monitoring.
Shipping Logs Without Building Detections
A central log store is not the same as operational monitoring. High-value events must be converted into queries, metrics and tested alerts.
Creating a New Promtail Deployment
Promtail is end of life. Existing implementations should plan migration, and new deployments should use Grafana Alloy or another supported collector.
Using Dynamic Loki Labels
Values such as audit IDs, resource names, usernames and source IPs can create excessive stream cardinality.
Keeping Logs Indefinitely by Default
Unlimited retention increases cost and may conflict with data governance requirements.
Alerting on Every Event
Single-event alerts create noise. Use severity, environment, identity, change windows and aggregation to separate normal operations from suspicious activity.
Production Checklist
Before considering Kubernetes audit monitoring complete, confirm that:
- Audit logging is enabled
- The policy has been reviewed for sensitive data exposure
- High-volume, low-value events are filtered
- Audit files persist outside the API server container
- Logs are sent to a central platform
- Collector and backend failures are monitored
- Audit-related API server metrics are monitored
- Loki labels have controlled cardinality
- CloudWatch or Loki retention is configured
- Audit data access is restricted
- RBAC and admission-control changes are monitored
- Interactive Pod access is monitored
- 401 and 403 activity is baselined
- Alerts have owners and runbooks
- Detection rules are tested regularly
Frequently Asked Questions
Are Kubernetes Audit Logs Enabled by Default?
For a self-managed cluster, the API server requires an audit policy and an audit backend. If no audit policy file is supplied, audit events are not recorded through the Kubernetes audit system.
On Amazon EKS, AWS manages the control plane audit policy. The audit control plane log type must be enabled for the cluster before those records are delivered to CloudWatch Logs.
Can Prometheus Collect Kubernetes Audit Logs?
Prometheus is designed for metrics rather than storing raw audit events. The Kubernetes API server exposes metrics about the audit subsystem, while additional metrics can be derived from logs using Loki recording rules or other log-processing systems.
What Is the Difference Between Audit Logs and Application Logs?
Audit logs record requests handled by the Kubernetes API server. Application logs record events produced by the software running inside containers. A deployment change may appear in the audit logs, while an exception caused by that deployment will usually appear in the application logs.
Can Audit Logs Detect a Compromised Container?
Not on their own. Audit logs may show API activity performed by the compromised workload, such as reading Secrets or creating resources. They will not record every process, file or network action inside the container. Runtime security and node-level monitoring are required for that visibility.
How Long Should Kubernetes Audit Logs Be Retained?
There is no single retention period for every organisation. Retention should be based on security investigation needs, compliance obligations, detection time, storage cost and archive requirements. The decision should be documented rather than inherited from a platform default.
Build a Production-Ready Kubernetes Audit Monitoring Strategy
Kubernetes audit logging is not complete when logs arrive in Loki or CloudWatch.
The operational value comes from connecting:
- A policy aligned with the organisation’s risk
- Reliable collection and storage
- Controlled cost and retention
- High-signal metrics and alerts
- Clear ownership when suspicious activity is detected
Bion helps teams assess, design and implement Kubernetes audit monitoring across Amazon EKS, self-managed Kubernetes and hybrid environments.
Our work can include:
- Reviewing existing audit policies and coverage
- Designing production audit policies
- Enabling EKS control plane logging
- Implementing Grafana Alloy and Loki pipelines
- Integrating audit data with existing observability or security tooling
- Building dashboards, metrics and detection rules
- Monitoring audit pipeline health
- Reviewing RBAC, admission controls and workload identities
- Creating alert runbooks and operational ownership
- Supporting the ongoing operation of production Kubernetes environments