When to Use New Relic with AWS via Terraform
This approach is well-suited for teams managing AWS infrastructure as code who want consistent, repeatable monitoring configuration across multiple environments. Using Terraform to manage New Relic resources helps reduce configuration drift, improves visibility, and aligns observability with infrastructure changes.
In AWS-based monitoring setups, the method used to collect metrics plays a critical role in data freshness, scalability, and operational reliability.
AWS Metric Collection Approaches
AWS metrics can be collected using different approaches, each with trade-offs around latency, scalability, and operational complexity. In modern AWS environments, metric streaming is generally preferred over traditional polling-based integrations.
Traditionally, polling mechanisms were used to gather data from AWS. However, Metric Streams, the preferred method for real-time data collection, offers several advantages:
No need for specific integration: All CloudWatch metrics from all AWS services and custom namespaces are available in New Relic at once without needing a specific integration to be built or updated.
Less delay: Metrics are streamed in less than two minutes since they are available in AWS CloudWatch.
No throttling: AWS API throttling is eliminated if you have large environments.
Overview of the Terraform-Based Integration
Let's talk about how to set up Metric Streams integration with Terraform. Before we start, let's make sure you have the following;
- An AWS account with appropriate permissions.
- A New Relic account with an API key for CloudWatch Metric Streams (refer to New Relic documentation for creating an API key).
- Terraform is installed and configured on your local machine.
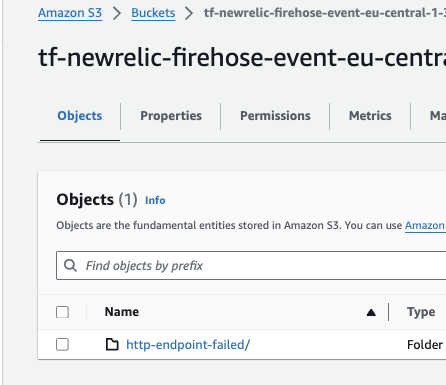
Step 1: Create an S3 Bucket
As a first step, we need to create an S3 bucket. We can use the following Terraform snippet to do so. The purpose of the S3 bucket is to ensure that source records, which are data metrics, can be recovered in case of a problem with record transfer.
After creating the bucket, You can check your S3 bucket on the AWS console.
Step 2: Create IAM Role for Data Firehose
This role, one of the 3 IAM roles we will create in this blog, is required for Data Firehose to write data and perform operations on the S3 bucket we created in the previous step.
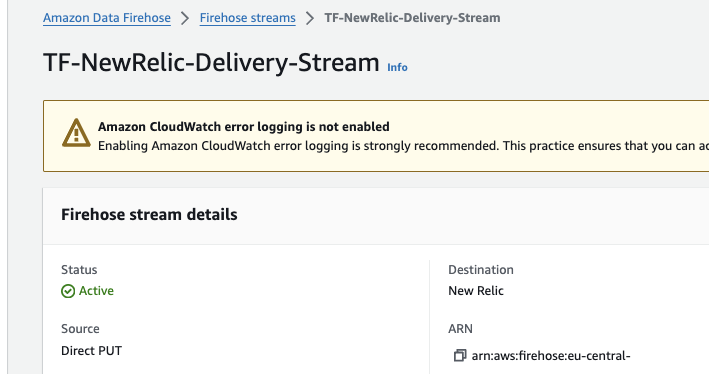
Step 3: Create Data Firehose
Amazon Data Firehose provides the easiest way to acquire, transform, and deliver data streams within seconds to data lakes, data warehouses, and analytics services. So, we need to create a Data Firehose to send the data from CloudWatch metrics to New Relic.
Here, we used the URL of the EU Datacenter, but you can put the URL of the US Datacenter according to the New Relic region you use.
- HTTP endpoint URL - US Datacenter: https://aws-api.newrelic.com/cloudwatch-metrics/v1
- HTTP endpoint URL - EU Datacenter: https://aws-api.eu01.nr-data.net/cloudwatch-metrics/v1
Now, we'll implement the New Relic license key. To use the license key securely, we'll create a parameter in the AWS Parameter Store service and put the New Relic license key as a value in this parameter.
Before we move on, I would like to emphasise one thing.
If you prefer to keep your Terraform code in a remote repository, we should prevent the New Relic license key from being exposed when pushing codes to a repository. For a more secure way to use it, you can store the key in the Parameter Store and use it locally via the data function in Terraform.
After applying the code, you can see the stream under the Amazon Data Firehose service.
Step 4: Create IAM Role for CloudWatch Metric Stream
The next question we should ask is, How will CloudWatch send these metrics to Data Firehose? For that, we need to create a stream using the CloudWatch service. This stream will collect metrics and send them to the Data Firehose service through an IAM role.
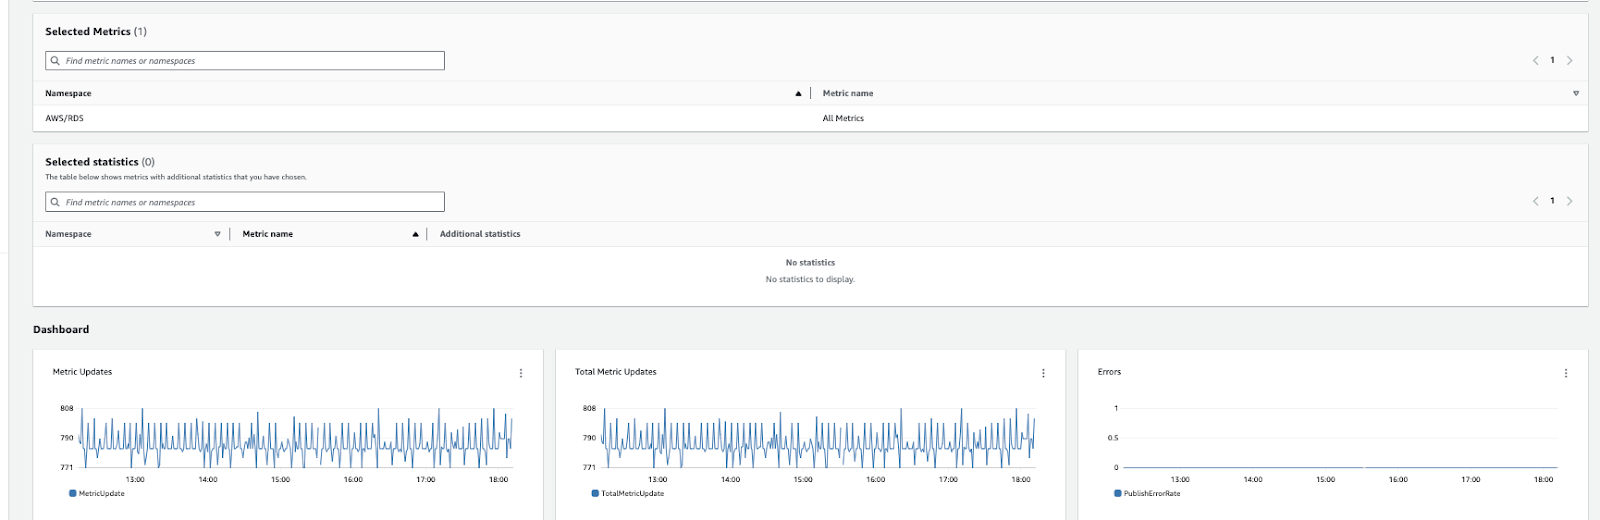
Step 5: Create CloudWatch Metric Stream
For demonstration purposes in this demo, I have collected only RDS metrics right now, but if there are metrics you want to collect according to your scenario, you can check this link and add it to the include_filter section in Terraform.
After creating the stream, you can see the metrics collected in CloudWatch Metric Stream as follows.
Final Step: Linking AWS and New Relic
All our resources on the AWS side are ready to push metrics to New Relic. Now, we will create one more IAM role for New Relic Infrastructure to retrieve monitoring data from your AWS account securely.
Mind changing your externalId before applying the following Terraform snippet.
After these operations, you can see that the metrics of your RDS instances are transferred to New Relic.

Cautions
- If you have multiple AWS accounts, you need to create this integration between each of them and New Relic.
- If you work multiple regions within those accounts, then each region needs to be configured with a different Kinesis Data Firehose pointing to New Relic.
- Please consider that AWS Kinesis Data Firehose costs; check pricing using the following link.
Terraform-Based Monitoring vs Manual Configuration
Why Infrastructure-as-Code Matters for Observability
Conclusion
New Relic simplifies application monitoring, delivering real-time insights to optimise performance, prevent downtime, and empower data-driven decisions for cost savings and broad visibility with a security focus.
In this blog post, we've covered the essentials of integrating AWS with New Relic. For further details beyond what's been discussed here, I recommend exploring the comprehensive documentation provided by New Relic; please follow the provided link. You can also access New Relic's official Terraform module via the link here or tailor your module using the code snippets I've shared.
As Bion, we are here to support you with our experience in New Relic and AWS; feel free to contact us here.