True DevOps observability means connecting every layer of your stack — from hosts and containers to deployments, users, and alerts — in one continuous flow of data.
New Relic unifies this visibility so your teams can monitor, measure, and improve everything they build.
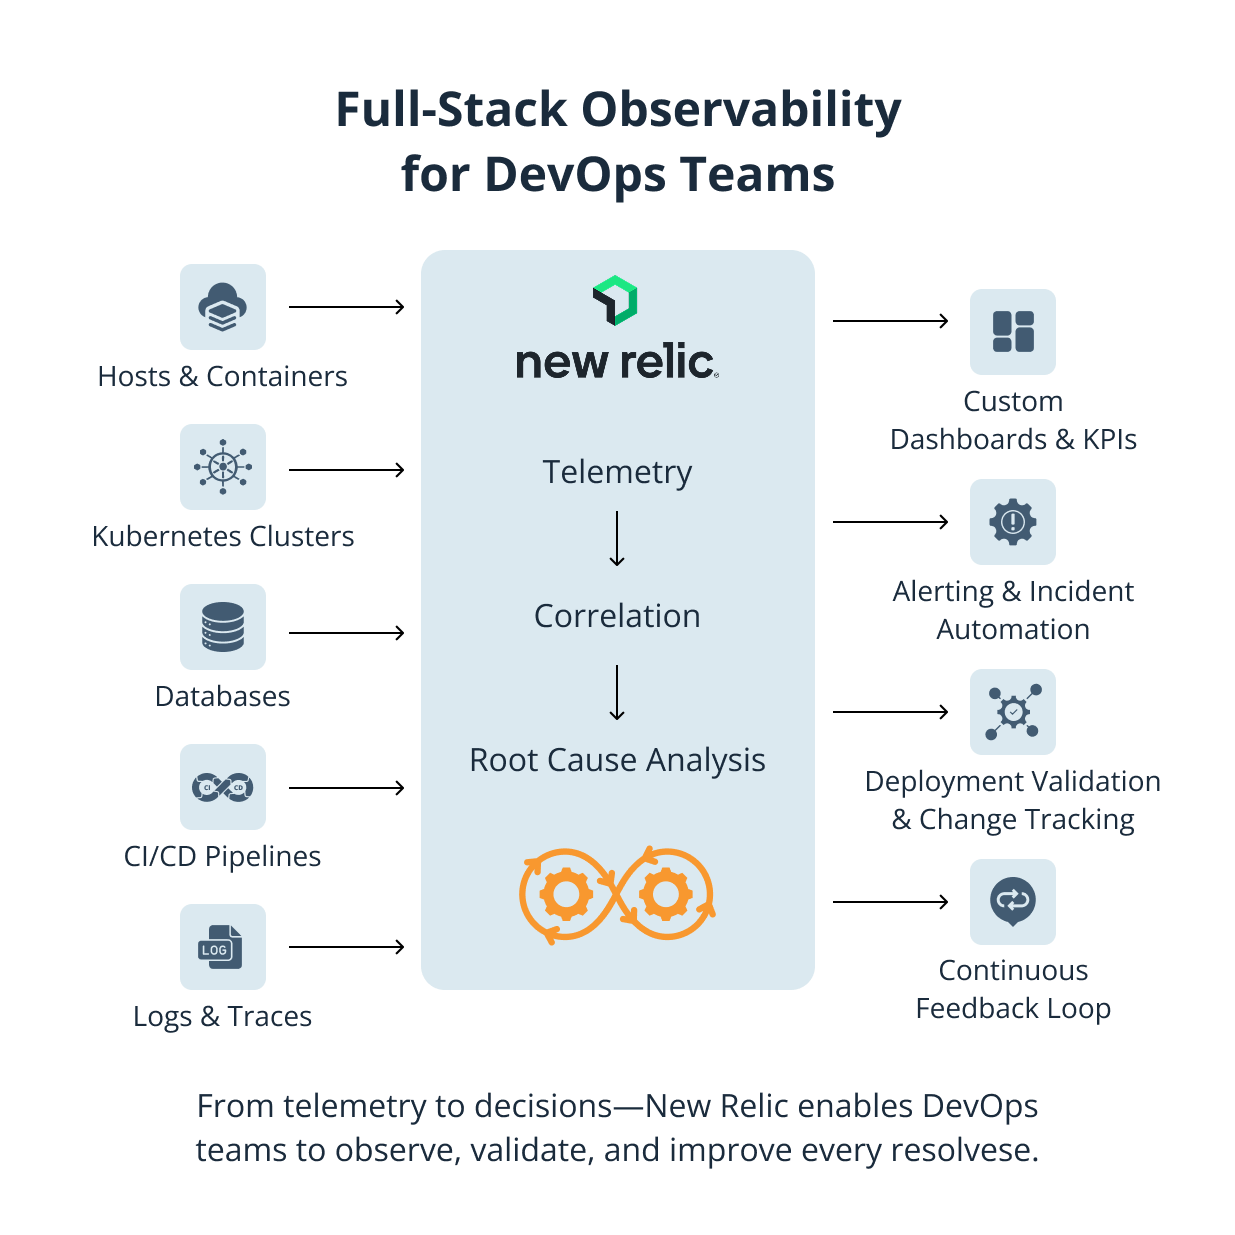
Infrastructure Monitoring – Every Host, Container, and Service
Infrastructure is the foundation of reliable delivery. New Relic provides deep visibility into compute, storage, and network components across hybrid and multi-cloud environments, allowing DevOps teams to monitor:
- Hosts & Virtual Machines: CPU, memory, disk I/O, and network throughput
- Containers: Lifecycle metrics, throttling, restarts, resource usage
- Kubernetes Clusters: Node, pod, and deployment health; scaling and scheduling behaviour
- Databases: Query latency, throughput, and connection pools across SQL/NoSQL
- Network & Inventory: Interface traffic, DNS latency, configuration drift, and package versions
- Events: Infrastructure changes correlated with alerts and traces
Application & Delivery Monitoring – From Code to Deployment
Every release introduces risk, and New Relic enables DevOps teams to measure its impact instantly — providing full visibility into application performance and delivery pipelines through key capabilities such as:
- APM & Services: Transaction traces, error rates, throughput, external dependencies
- Change Tracking: Automatically tag code releases and visualise performance impact
- CI/CD Integration: Pipeline event tracking from Jenkins, GitHub, or GitLab
- Distributed Tracing: Follow requests across microservices and APIs
- Error Analytics: Detect new exceptions and route them to the right team via Error Inbox
User Experience Monitoring – Validate What Customers See
Observability extends beyond servers and code, giving DevOps teams the ability to monitor how real users experience their systems through features such as:
- Synthetic Monitoring: Global uptime and API checks simulating user journeys
- Browser Monitoring: Page load time, JS errors, and session traces
- Mobile Monitoring: App latency, crashes, and network performance on iOS & Android
Alerting & Incident Automation – Respond Before Users Notice
Proactive alerting helps DevOps teams move from reactive troubleshooting to earlier detection, and Bion helps teams design alert policies and workflows that prioritise what truly matters using New Relic Alerts, Workflows, and AI-assisted reliability capabilities such as New Relic SRE Agent.
These capabilities help teams:
- Define intelligent thresholds and anomaly detection
- Correlate related alerts to reduce noise
- Connect logs, metrics, traces, deployments, and service changes during incidents
- Integrate with Slack, PagerDuty, or ServiceNow for fast notification
- Use AI-assisted investigation to identify likely root causes faster
- Track incidents end-to-end and continuously improve response processes
AI-Assisted Reliability with New Relic SRE Agent
As DevOps and SRE teams manage increasingly distributed systems, incident response is no longer just about receiving alerts. Teams need to understand what changed, which services are affected, where the likely root cause sits, and what actions should be taken next.
New Relic SRE Agent, currently available as part of New Relic’s public preview programme, brings AI-assisted investigation into the observability workflow by correlating telemetry across logs, metrics, traces, deployments, services, and infrastructure. This helps engineering teams move from alert noise to structured investigation, reducing the time spent searching across dashboards, queries, and past incident context.
For DevOps teams, this means New Relic can support a more guided reliability workflow across:
- Incident detection and abnormal behaviour analysis
- Correlation of logs, metrics, traces, deployments, and service dependencies
- Faster root-cause investigation using live telemetry context
- Recommended remediation actions for engineer review
- Runbook-aware workflows with human confirmation for production actions
- Reduced operational toil during high-pressure incidents
Bion helps engineering and platform teams prepare their New Relic environments for this next stage of reliability operations. This includes telemetry quality, service mapping, alert design, runbook alignment, dashboard structure, ownership models, and incident workflows — so AI-assisted investigation has the right operational context to work from.
Used correctly, New Relic SRE Agent should not replace engineering judgement. It should help teams investigate faster, reduce manual troubleshooting effort, and respond to incidents with better context and control.